Real-Time Audio Visualization
A web tool that analyzes audio files in real-time, displaying frequencies as animated color bars that respond to amplitude.
Project Overview
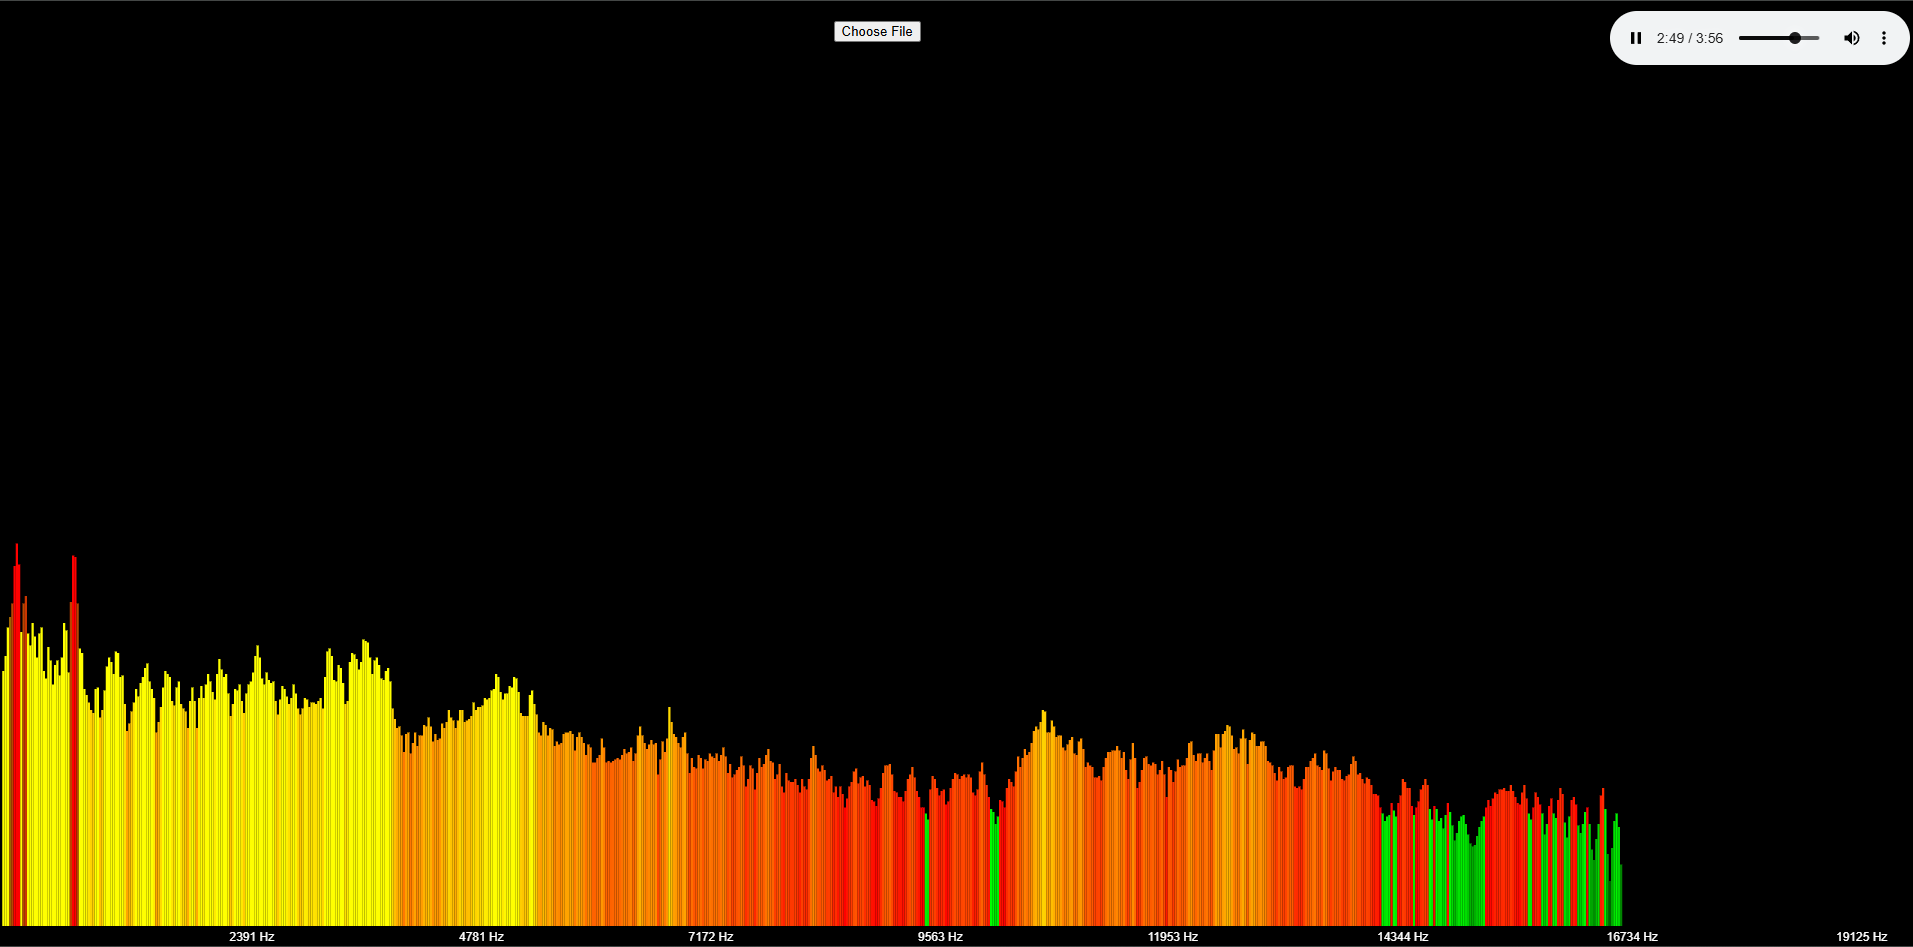
This interactive audio visualizer transforms any uploaded audio file into a vibrant frequency spectrum display . Using the Web Audio API, it analyzes sound in real-time, breaking it down into its frequency components which are then rendered as a dynamic bar graph.
Key Features
- Full frequency analysis - Visualizes the full audible range (20Hz-20kHz)
- Color-coded intensity - Bars change from green (quiet) to red (loud)
- Real-time rendering - Smooth animations using requestAnimationFrame
- Responsive design - Adapts to any screen size
- Client-side processing - No server requirements, works entirely in browser
Technical Implementation
The application uses the Web Audio API's AnalyserNode to process audio data, performing Fast Fourier Transform (FFT) to extract frequency information. The Canvas API renders the visualization with optimized performance, while the File API handles audio uploads. Color mapping is dynamically calculated based on amplitude values.